San Antonio
Take charge of your financial future with revealing visualizations of financial analysis.
A Smarter San Antonio Starts With Smarter Land Use
San Antonio is growing — but is it growing wisely?
Behind the scenes of our city’s development, there’s a silent force driving our budget, our infrastructure costs, and our neighborhood stability: how we use land.
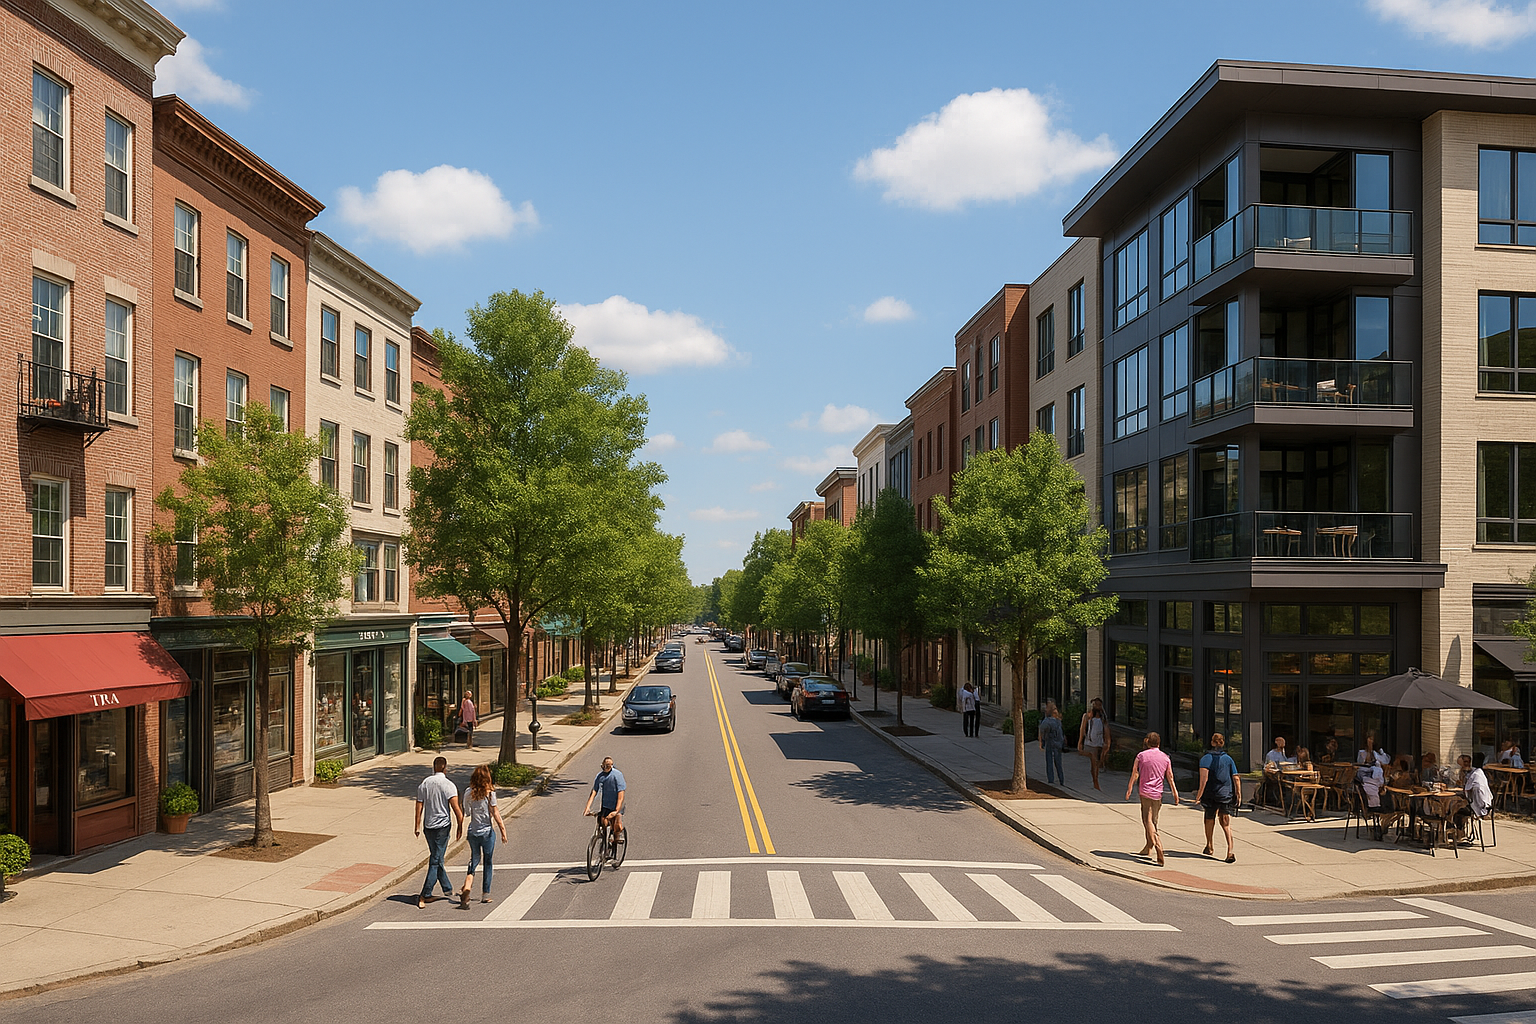
Urban3’s analysis of San Antonio reveals something simple yet powerful — compact, walkable neighborhoods and vibrant downtown blocks aren’t just charming, they’re financial powerhouses. Meanwhile, sprawling, car-centric development is eating away at our city’s budget and saddling us with growing infrastructure costs we can’t keep up with.
This isn’t about ideology. It’s about math.
Urban3’s data gives us the tools to see what’s working, what’s wasting our resources, and what decisions we can make right now to secure a more resilient, equitable, and prosperous San Antonio.
Want to move on to the next section? Options could include:
- What the Data Shows – Visual, digestible insights from the report (e.g., VPA, downtown productivity).
- The Hidden Cost of Sprawl – Infrastructure liabilities and budget implications.
- The Equity Angle – Property tax fairness and redlining legacy.
- What San Antonio Can Do – A call to adopt smarter development policies based on Urban3's insights.
Expanding Sections
The Equity Angle
A fair tax system is one where everyone pays their share — no more, no less. But in San Antonio, that’s not the reality for many families. Urban3’s assessment equity analysis reveals a troubling pattern: the lowest-value homes are often over assessed, while higher-value homes tend to be under assessed.
Read more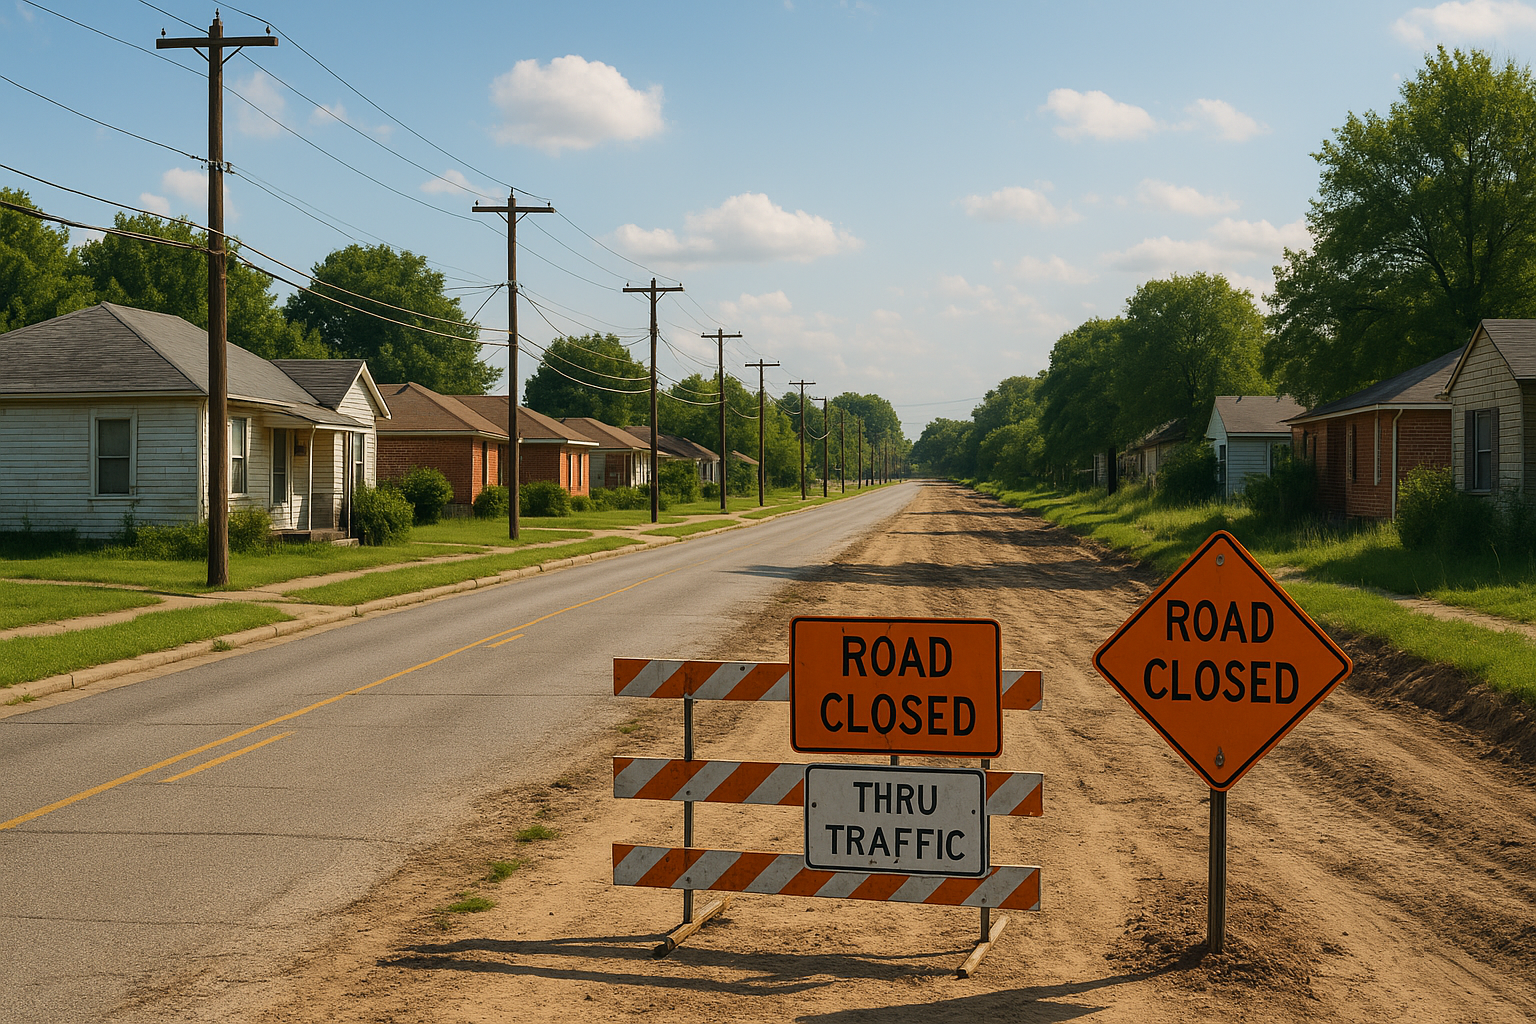
The Hidden Cost of Sprawl
Sprawl might look cheap on the surface — but San Antonio is paying the price.
Read more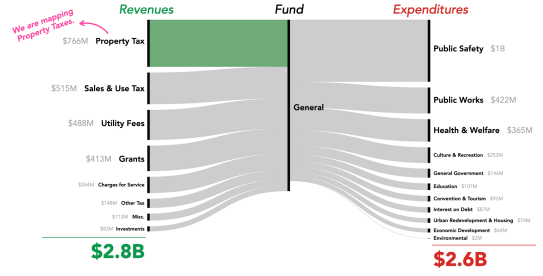
Understanding the Financial Landscape
A city’s financial health depends on its ability to generate revenue while efficiently managing costs. San Antonio’s economic future is tied to its tax structure, infrastructure spending, and land use policies. Understanding these financial mechanisms is key to making data-driven decisions that support long-term sustainability.
Read more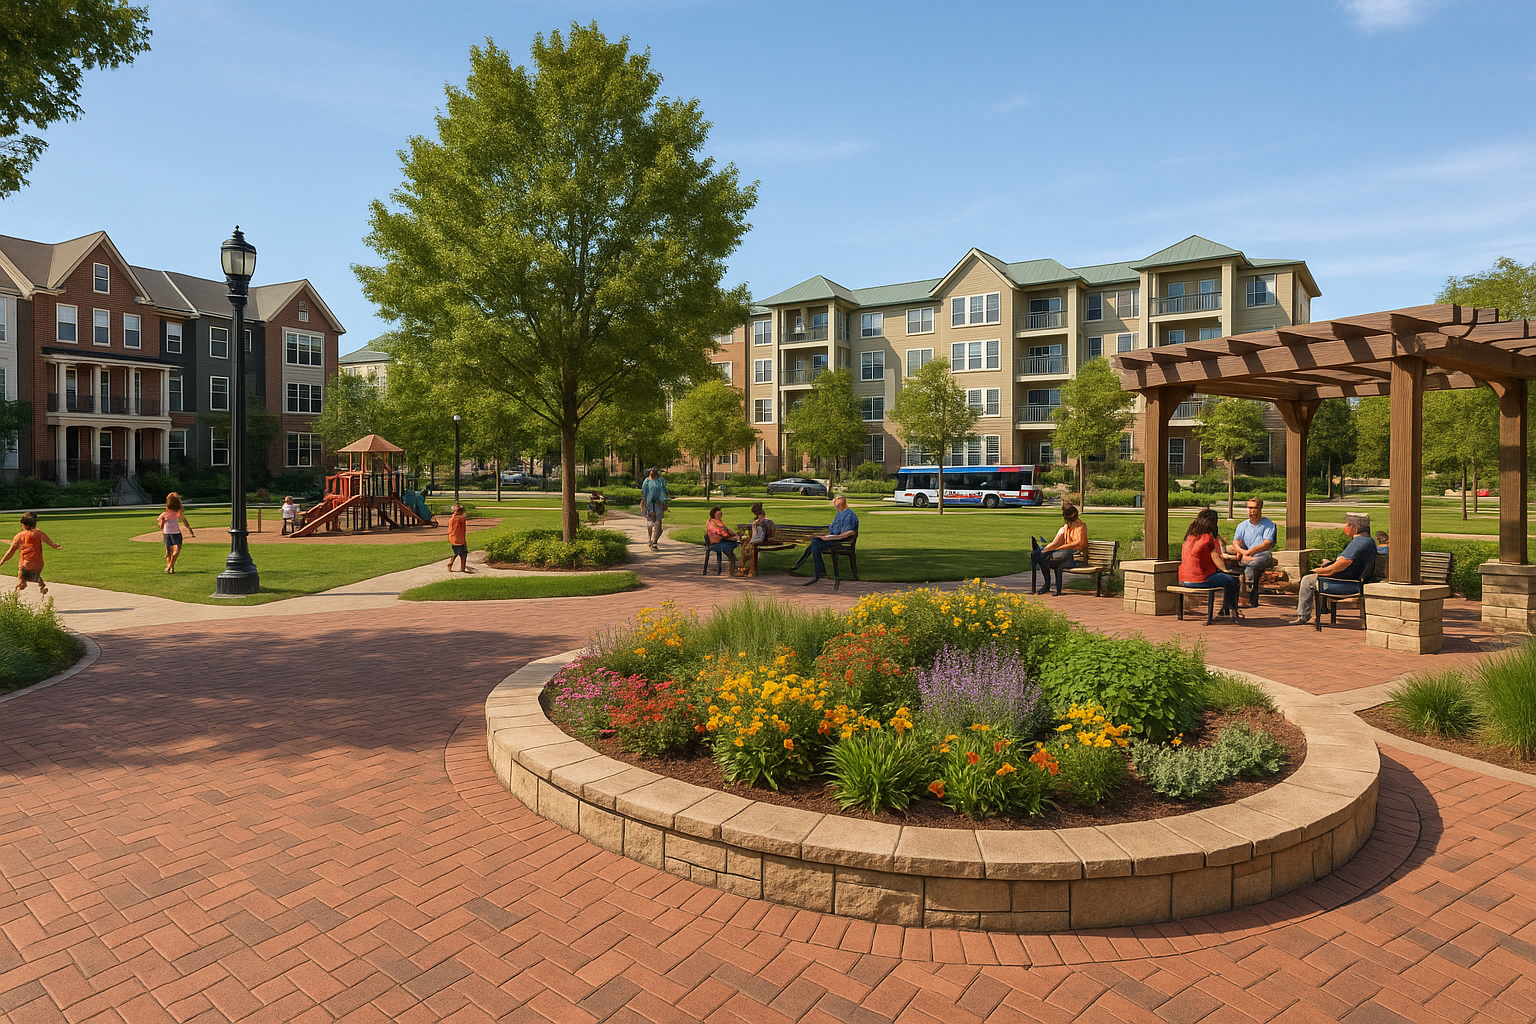
What San Antonio Can Do
San Antonio has a choice to make. The data is in, the patterns are clear, and the tools are available. We can continue business as usual — subsidizing sprawl, ignoring systemic inequities, and falling behind on infrastructure. Or we can take a smarter, data-driven approach to growth.
Read more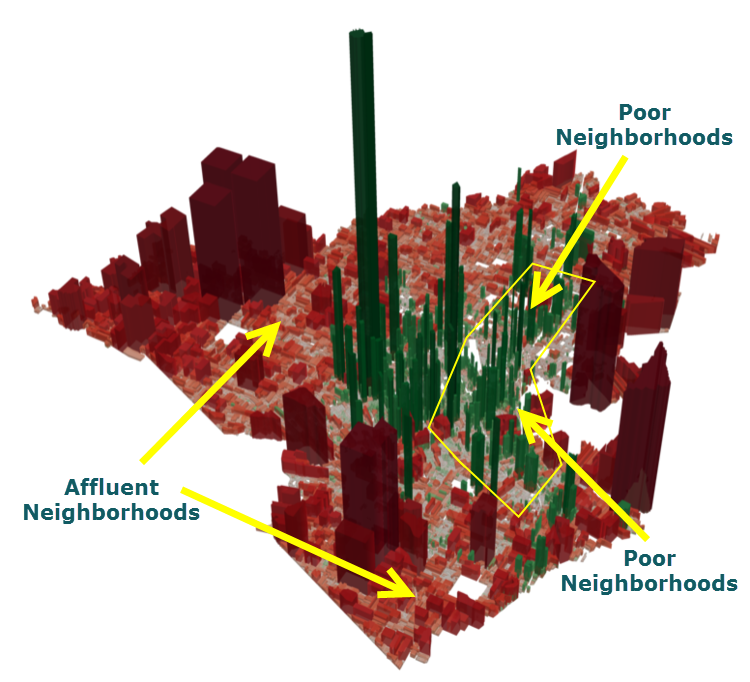
What the Data Shows
San Antonio’s land is not equally productive — and that has big consequences for the city’s financial health. Urban3’s analysis flips the script on how we typically measure value. Instead of simply looking at the total tax revenue from a property, they ask: how much value is produced per acre of land? When you consider land as a finite resource, this question becomes crucial. Just like we wouldn’t judge a car by how far it can go on one tank without knowing the size of the tank, we shouldn’t judge development by its total value without considering how much space it consumes.
Read moreShallow Dive

Value Per Acre
Total value is one way to analyze the overall value of a city, but when it comes to understanding economic productivity, it is not always the most useful. Urban3’s analysis focuses on the “per acre” metric as a unit of productivity. After all, cities and counties are, at their simplest, finite areas of land. How that land is used has a direct effect on municipal budgets. The per acre metric normalizes total revenues and tax values, creating direct “apples-to-apples’’ comparisons utilizing land consumed as a unit of productivity. Using value per acre (VPA) to compare properties is like using miles per gallon (MPG) to compare cars. When comparing cars, the miles a car can go per tank isn’t typically referenced because it reflects the size of the tank, not how efficient the engine is. We apply the same principle to measure the financial productivity of various development types across a community.

Understanding Local Finance
To understand the financial health of a community, we must begin by understanding the underlying tax structure. Most communities rely on a mixture of revenues, primarily from taxes, user fees, and state and federal government. Taxes tend to comprise a large share of local revenue. Communities use these funds to run their government, pay for public services, and build and maintain infrastructure. When available, spatial data allows Urban3 to map and visualize both tax revenue and infrastructure costs, an approach we call “geoaccounting.” We use geoaccounting to uncover the relationship between land use decisions and public revenue production. When public revenues vary geographically, comparisons can be made to other spatially relevant factors, such as development patterns, commuting patterns, and public investment. Analyzing both the source of government revenues and the patterns they come from is critical to planning for a strong financial future. The Bexar Central Appraisal District (CAD) is responsible for assessing and assigning the value of real property at
Chapters
The Equity Angle
A fair tax system is one where everyone pays their share — no more, no less. But in San Antonio, that’s not the reality for many families. Urban3’s assessment equity analysis reveals a troubling pattern: the lowest-value homes are often over assessed, while higher-value homes tend to be under assessed.
The Hidden Cost of Sprawl
Sprawl might look cheap on the surface — but San Antonio is paying the price.
Understanding the Financial Landscape
A city’s financial health depends on its ability to generate revenue while efficiently managing costs. San Antonio’s economic future is tied to its tax structure, infrastructure spending, and land use policies. Understanding these financial mechanisms is key to making data-driven decisions that support long-term sustainability.
What San Antonio Can Do
San Antonio has a choice to make. The data is in, the patterns are clear, and the tools are available. We can continue business as usual — subsidizing sprawl, ignoring systemic inequities, and falling behind on infrastructure. Or we can take a smarter, data-driven approach to growth.
What the Data Shows
San Antonio’s land is not equally productive — and that has big consequences for the city’s financial health. Urban3’s analysis flips the script on how we typically measure value. Instead of simply looking at the total tax revenue from a property, they ask: how much value is produced per acre of land? When you consider land as a finite resource, this question becomes crucial. Just like we wouldn’t judge a car by how far it can go on one tank without knowing the size of the tank, we shouldn’t judge development by its total value without considering how much space it consumes.
How we got here
-
Data Gathering Begins
Urban3 began collecting public data from the Bexar County Appraisal District, City of San Antonio budgets, and infrastructure reports. They focused on parcel-level property values, land use patterns, and infrastructure cost data, laying the groundwork for spatial economic analysis.
-

Geoaccounting Applied
Using their signature geoaccounting method, Urban3 mapped tax revenues and infrastructure costs across San Antonio. This revealed where public investments were returning strong value — and where they were not.
-
Value Per Acre Model Created
Urban3 produced both 2D and 3D models of Value Per Acre (VPA), clearly showing how compact, mixed-use areas — especially downtown — significantly outperformed low-density sprawl in generating tax revenue per acre.
-
Infrastructure Cost Modeling
By comparing San Antonio’s actual spending to projected lifecycle costs, Urban3 identified major shortfalls: $73 million annually in road maintenance, and $49 million in stormwater system funding. These gaps represent long-term liabilities the city must plan for.
-
Equity and Assessment Analysis
Urban3 assessed fairness in property tax assessments using real sales data and historic redlining overlays. Their findings showed systemic overassessment in low-income areas and underassessment in affluent ones — a fiscal and social justice issue rooted in past policy.
-
Findings Delivered
Urban3 presented their full report to city officials, planners, and the public. Their recommendations offer a data-driven roadmap to more equitable, financially sustainable development in San Antonio.